
Fewer and fewer stocks are moving the stock markets higher in the U.S. and Canada. This is a classic case of bad breadth.
There are a lot of methods to measure market breadth, but all of them are essentially measuring the same thing: the degree to which all of the stocks in the index are participating in the broad stock market movement.
Bad breadth occurs when the broad stock market is performing well, but most stocks are not participating in the rally.
Both the S&P 500 and the S&P/TSX Composite Index are not too far off their all-time highs, but many stocks in the indexes have been declining.
Forty-three per cent of the S&P 500 companies and 38 per cent of the S&P/TSX Composite companies are currently 20 per cent or more below their 52-week high (Bloomberg).
It is very unusual to see such a large number of stocks in “bear market” territory when the broad stock markets are so close to their all-time highs.
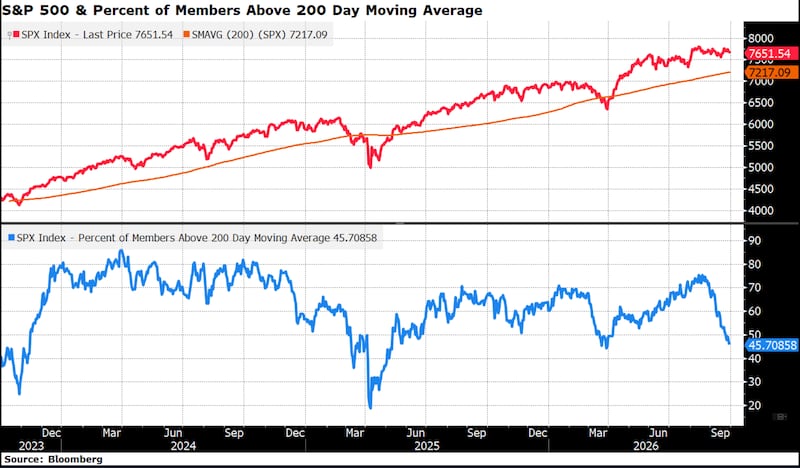
One of the ways to measure market breadth is measuring the percentage of stocks in the index that are trading above or below their 200 day moving averages.
In a healthy bull market, the normal condition is for most stocks to be trading above their 200 day moving averages and trending higher.
Over the last month and half, the number of stocks in the S&P 500 above their 200 day moving averages has been declining sharply and is currently 46 per cent (blue line in graph below).
This has been occurring at a time when the S&P 500 has been in a sideways trend. In other words, a few stocks that are performing well are offsetting the effect of all of the other stocks that are performing poorly.
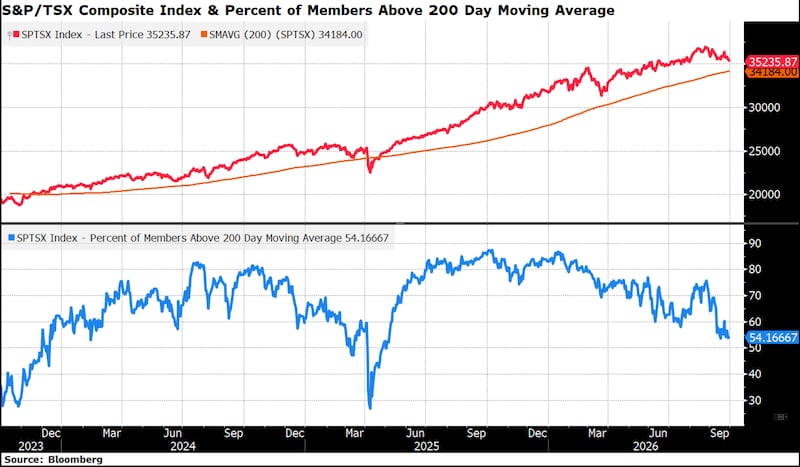
The S&P/TSX Composite is also showing bad market breadth. As the broad market index has been trending higher (red line in the graph below), the percentage of companies above their 200 day moving averages has been trending lower since December (blue line).
The divergence between the price action and the percentage of stocks trading above their 200 day moving averages is not a sign of a healthy market.
Below are the top performing parts of the S&P/TSX Composite since Dec. 1, 2025, when the market breadth started to deteriorate (Bloomberg):
- Energy dominates the top: Cenovus (+78.1%), Suncor (+55.9%), Canadian Natural Resources (+44.0%), and Imperial Oil (+27.8%) all rank highly, reflecting strong oil price performance
- Canadian banks swept the mid-table: All six major banks appear in the top 20, with TD (+43.9%) leading the group
- Insurers and financials: Great-West Lifeco (+42.0%), Sun Life (+38.8%), Power Corp (+28.6%), and Manulife (+24.6%) all feature strongly
- Materials: Teck Resources (+53.0%), Lundin Mining (+30.1%), and Wheaton Precious Metals (+21.8%) round out the list
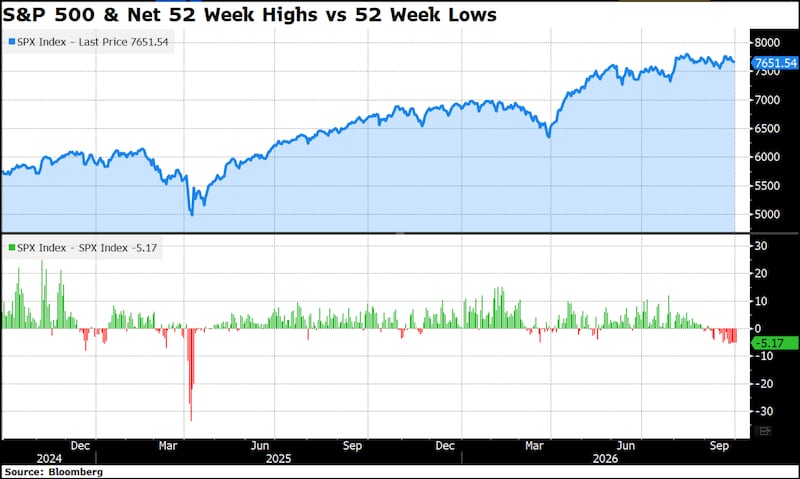
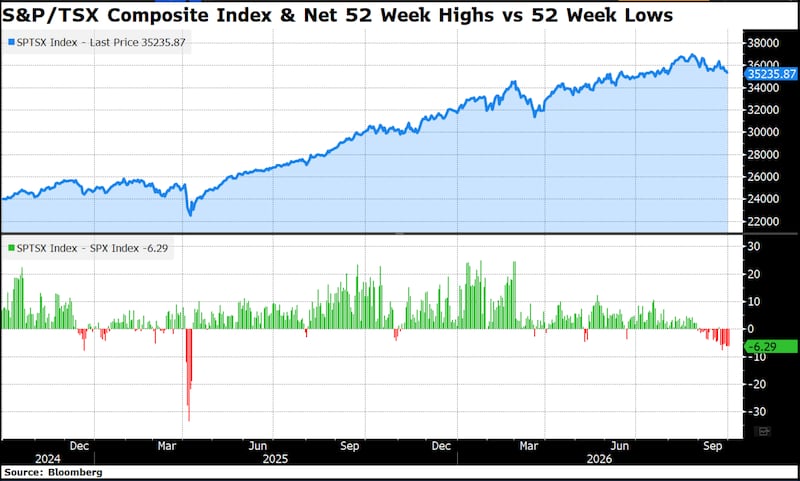
In a healthy bull market, the percentage of companies hitting 52-week highs should be much larger than the number of stocks hitting 52-week lows.
When the stock market is close to an all-time high it would be expected that more stocks would be hitting their 52-week highs than their lows.
Recently, the number of stocks hitting their 52-week lows has been larger than the number of stocks hitting their 52-week highs (red bars in the graph below).
In Canada, the net difference between the 52-week highs and 52-week lows is growing increasingly negative (red bars in graph below).
Bad breadth in the stock markets does not necessarily mean that the markets are heading lower.
In fact, theoretically market breadth could get worse and at the same time the stock markets head higher.
However, bad breadth does indicate that the stock markets’ internals are becoming weaker, making them more susceptible to a correction.
---
The views and opinions expressed herein are solely those of the author(s) and may not necessarily reflect the views of Global X Investments Canada Inc. All comments, opinions and views expressed are generally based on information available as of the date of publication and should not be considered advice to purchase or sell any securities mentioned. Before making any investment decision, please consult your investment advisor or advisors.